See What You Get
Every Par The Course yardage book is built around your clubs, your distances, and your strategy preferences. Here's exactly what's inside.
Personalized cover page with your player profile, club bag, caddie strategy, and weather conditions
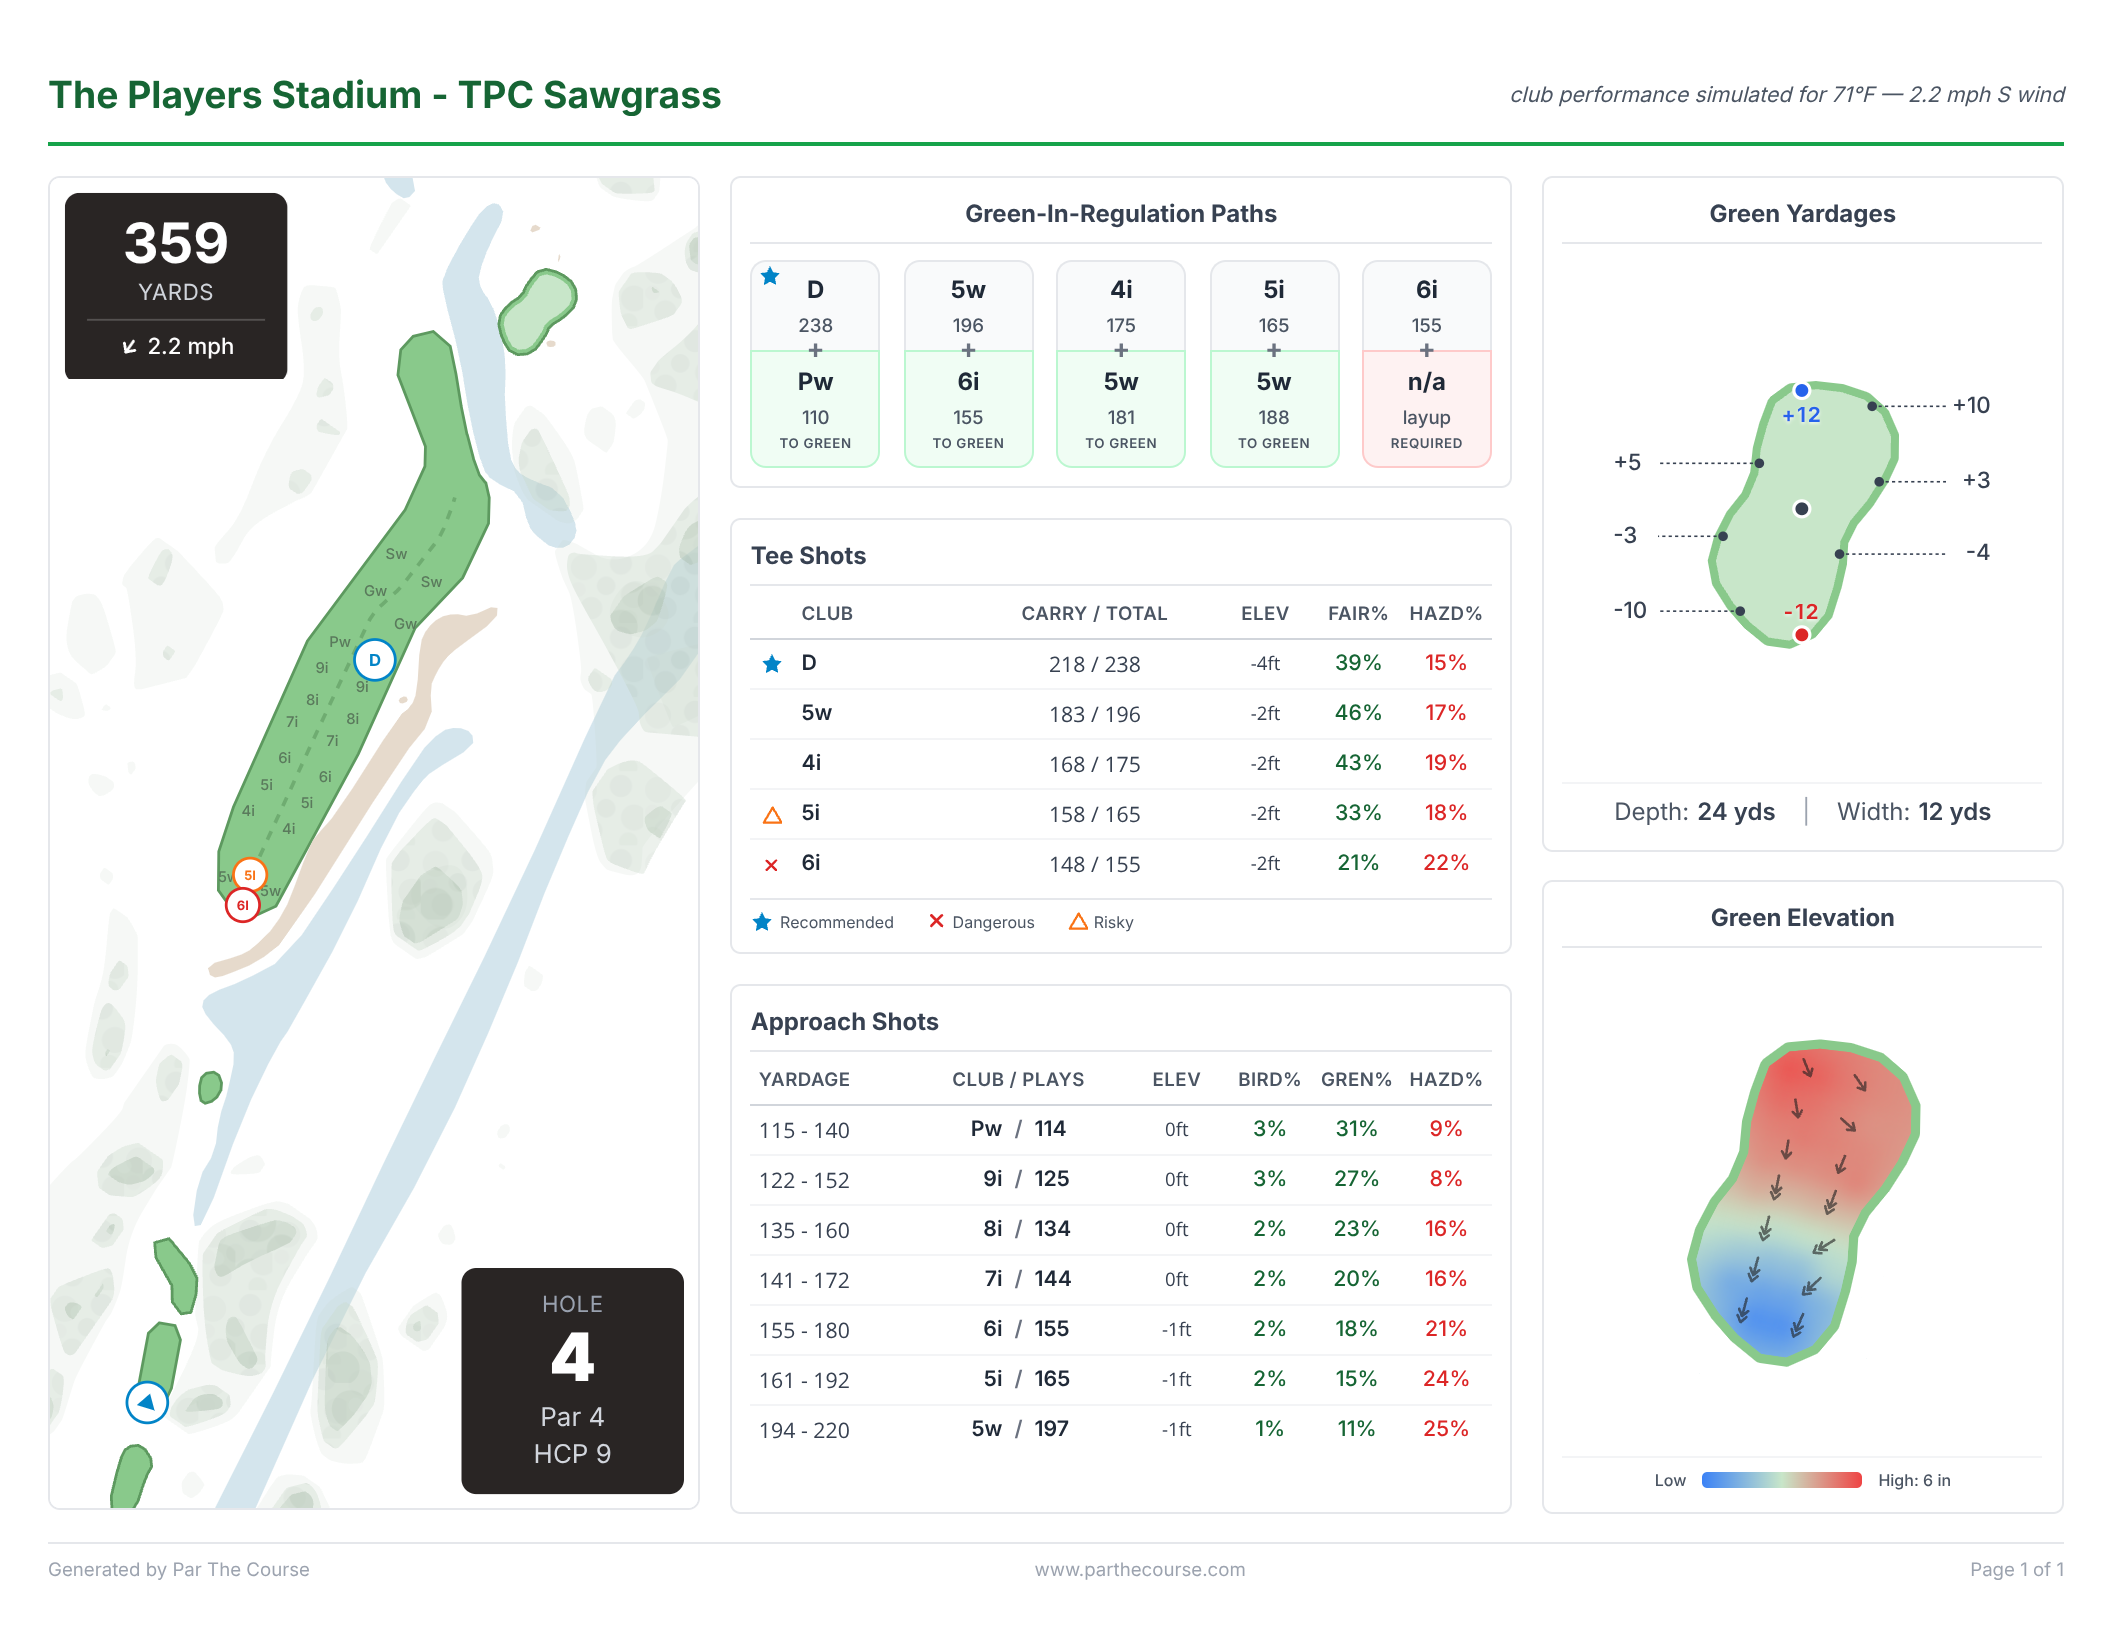
Hole strategy page with aerial view, tee shot recommendations, and approach data tailored to your distances
Green reading map with elevation heatmap, slope arrows, break direction, and best leave zones
Detailed hazard breakdown and scoring probabilities for every strategy option
Full 18-hole summary — recommended clubs, yardages, and strategy at a glance
What's Inside Every Guide
Each guide is a complete hole-by-hole strategy document personalized to your game.
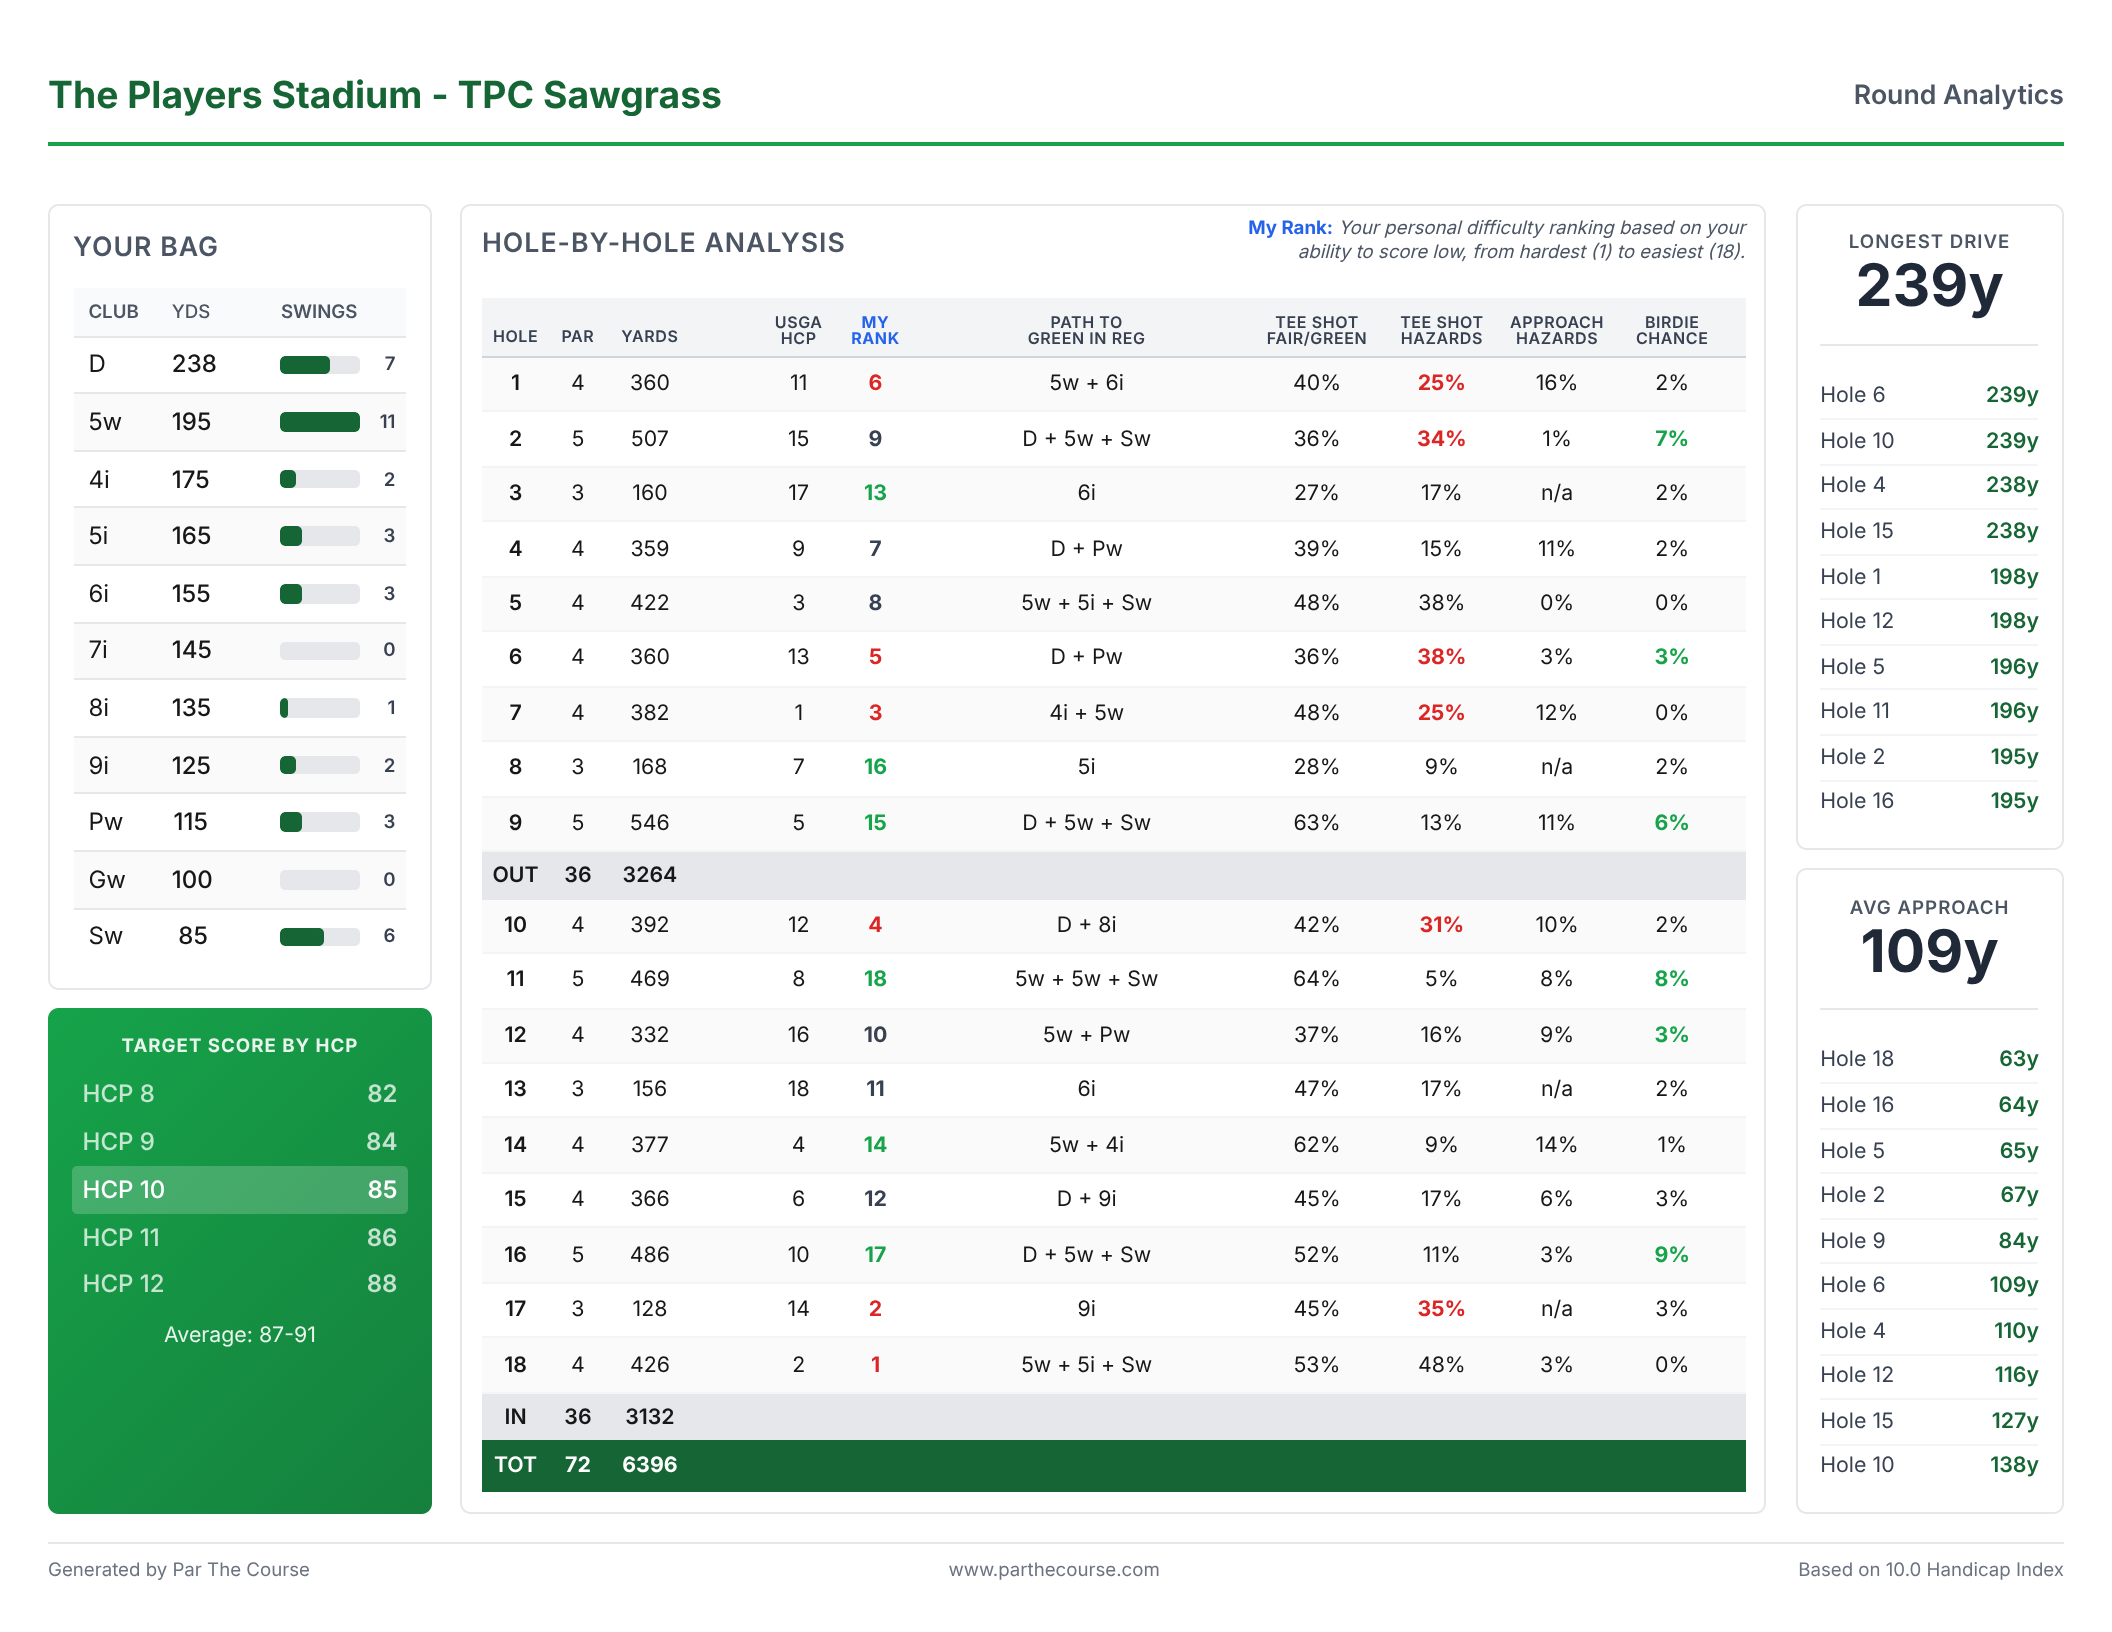
18-Hole Summary
A full-round summary page with recommended clubs, yardages, and strategy notes for every hole at a glance — perfect for a quick reference on the course.
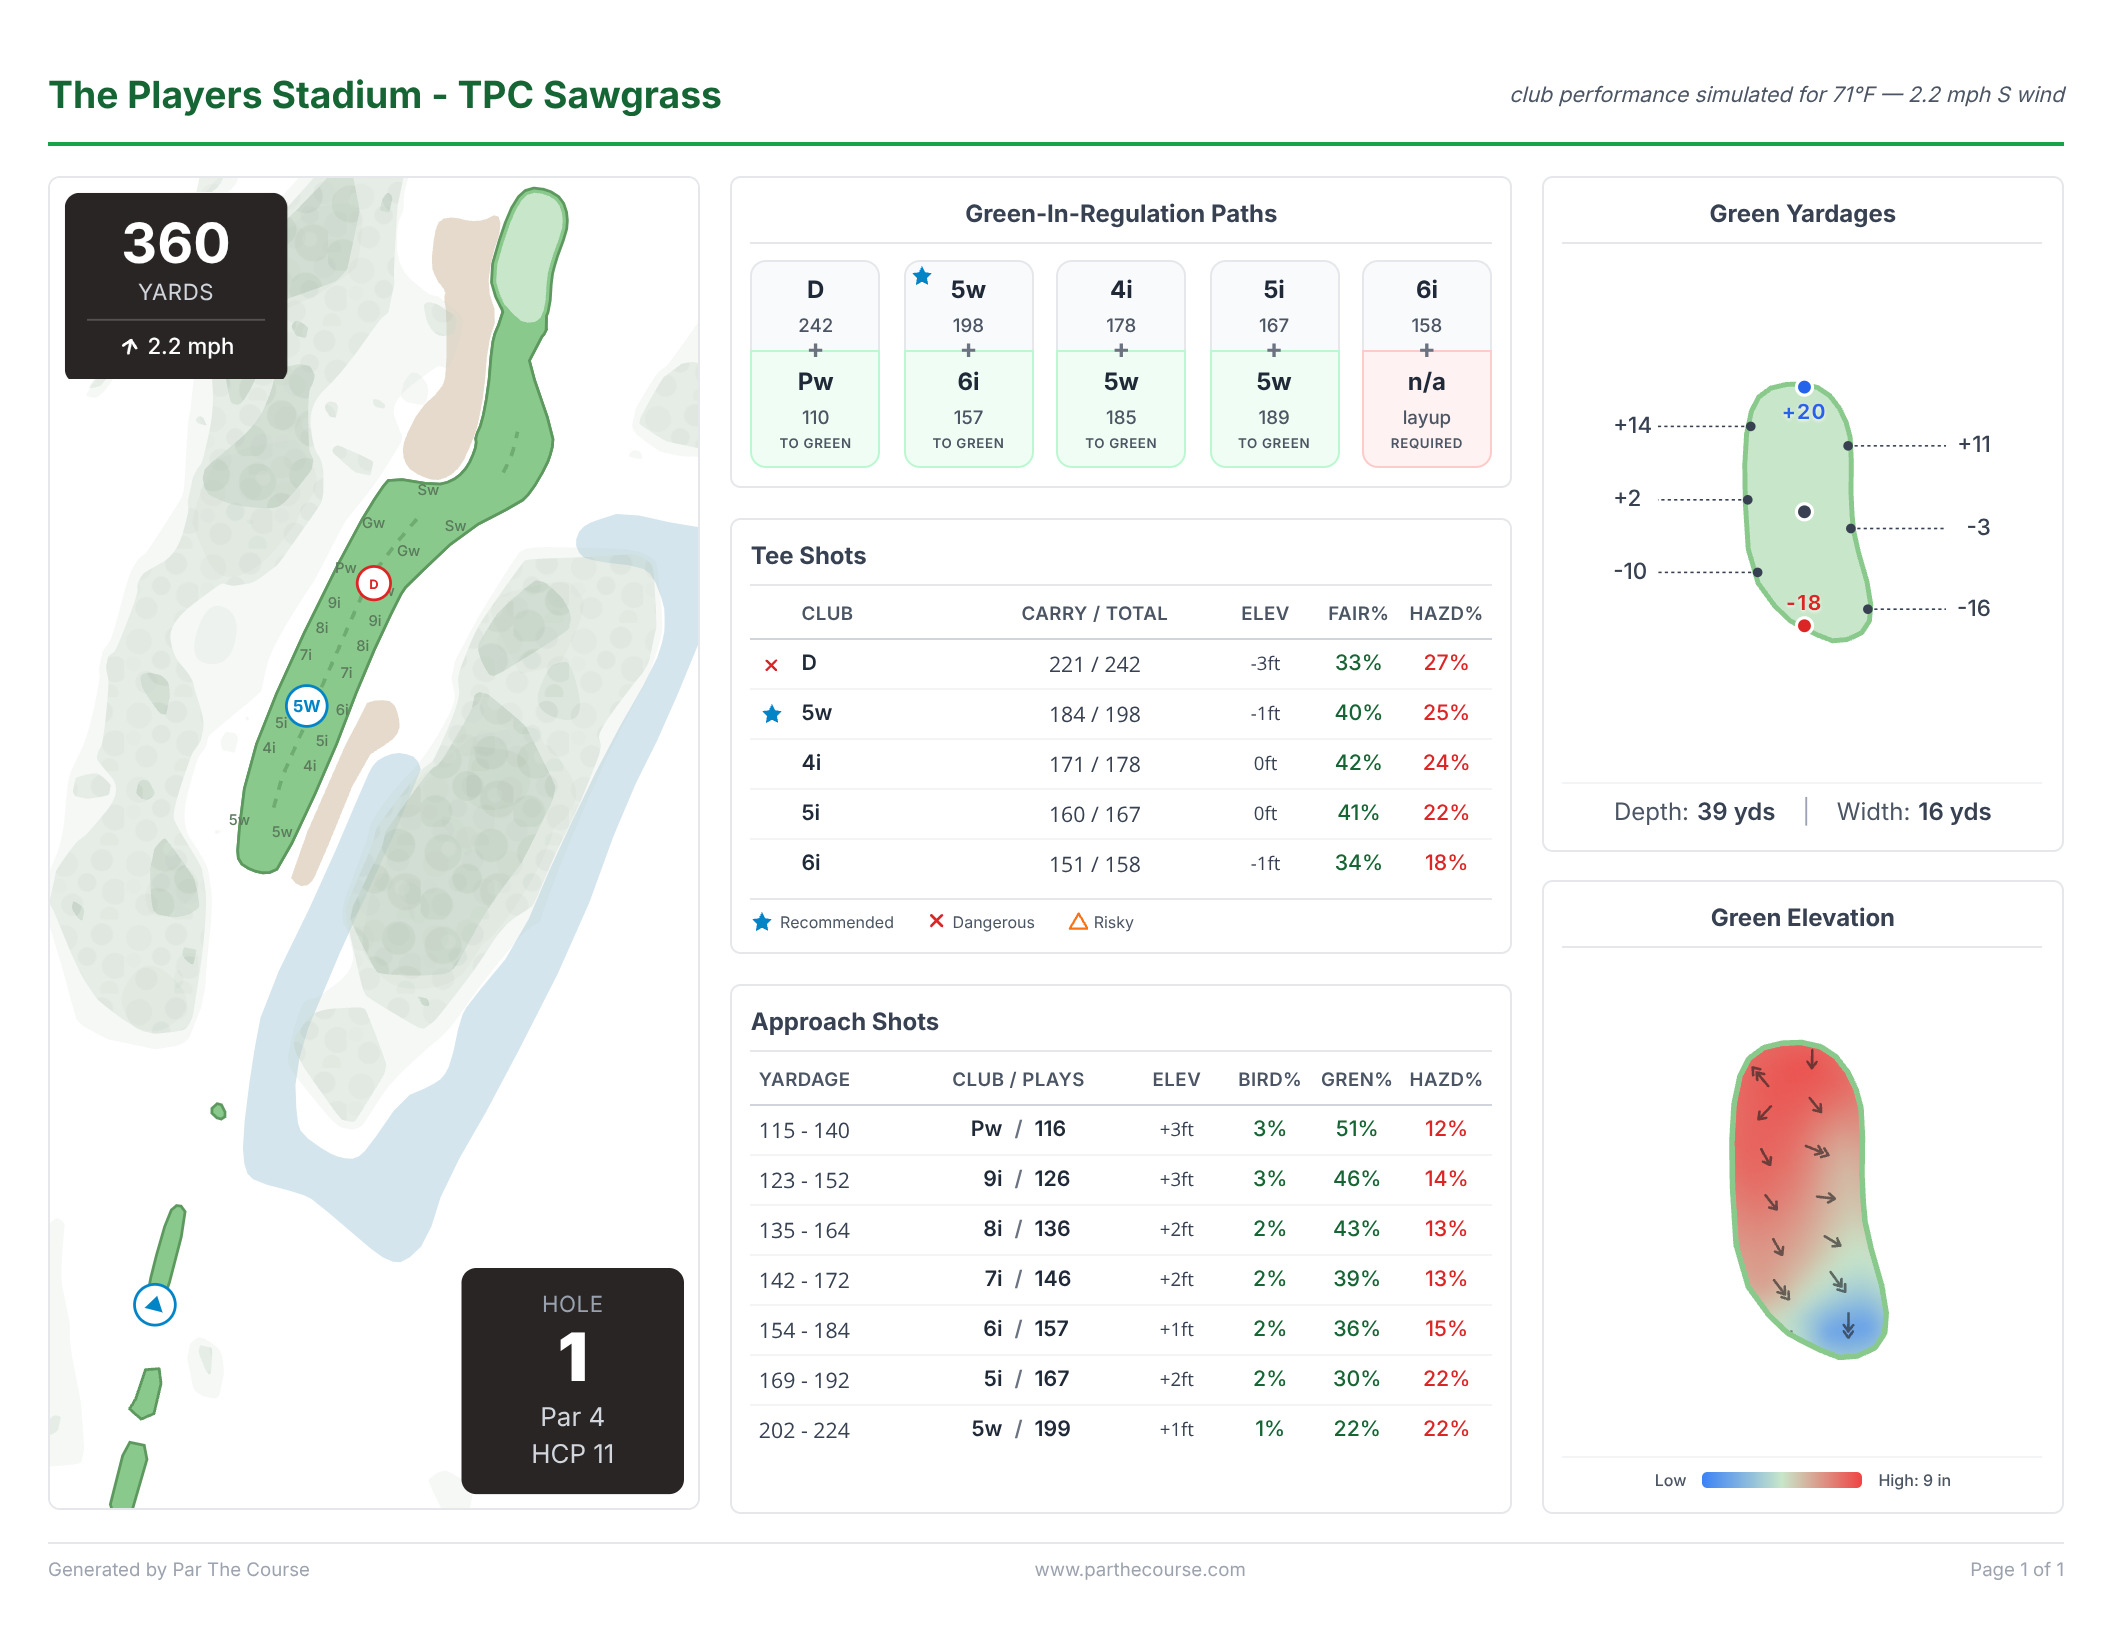
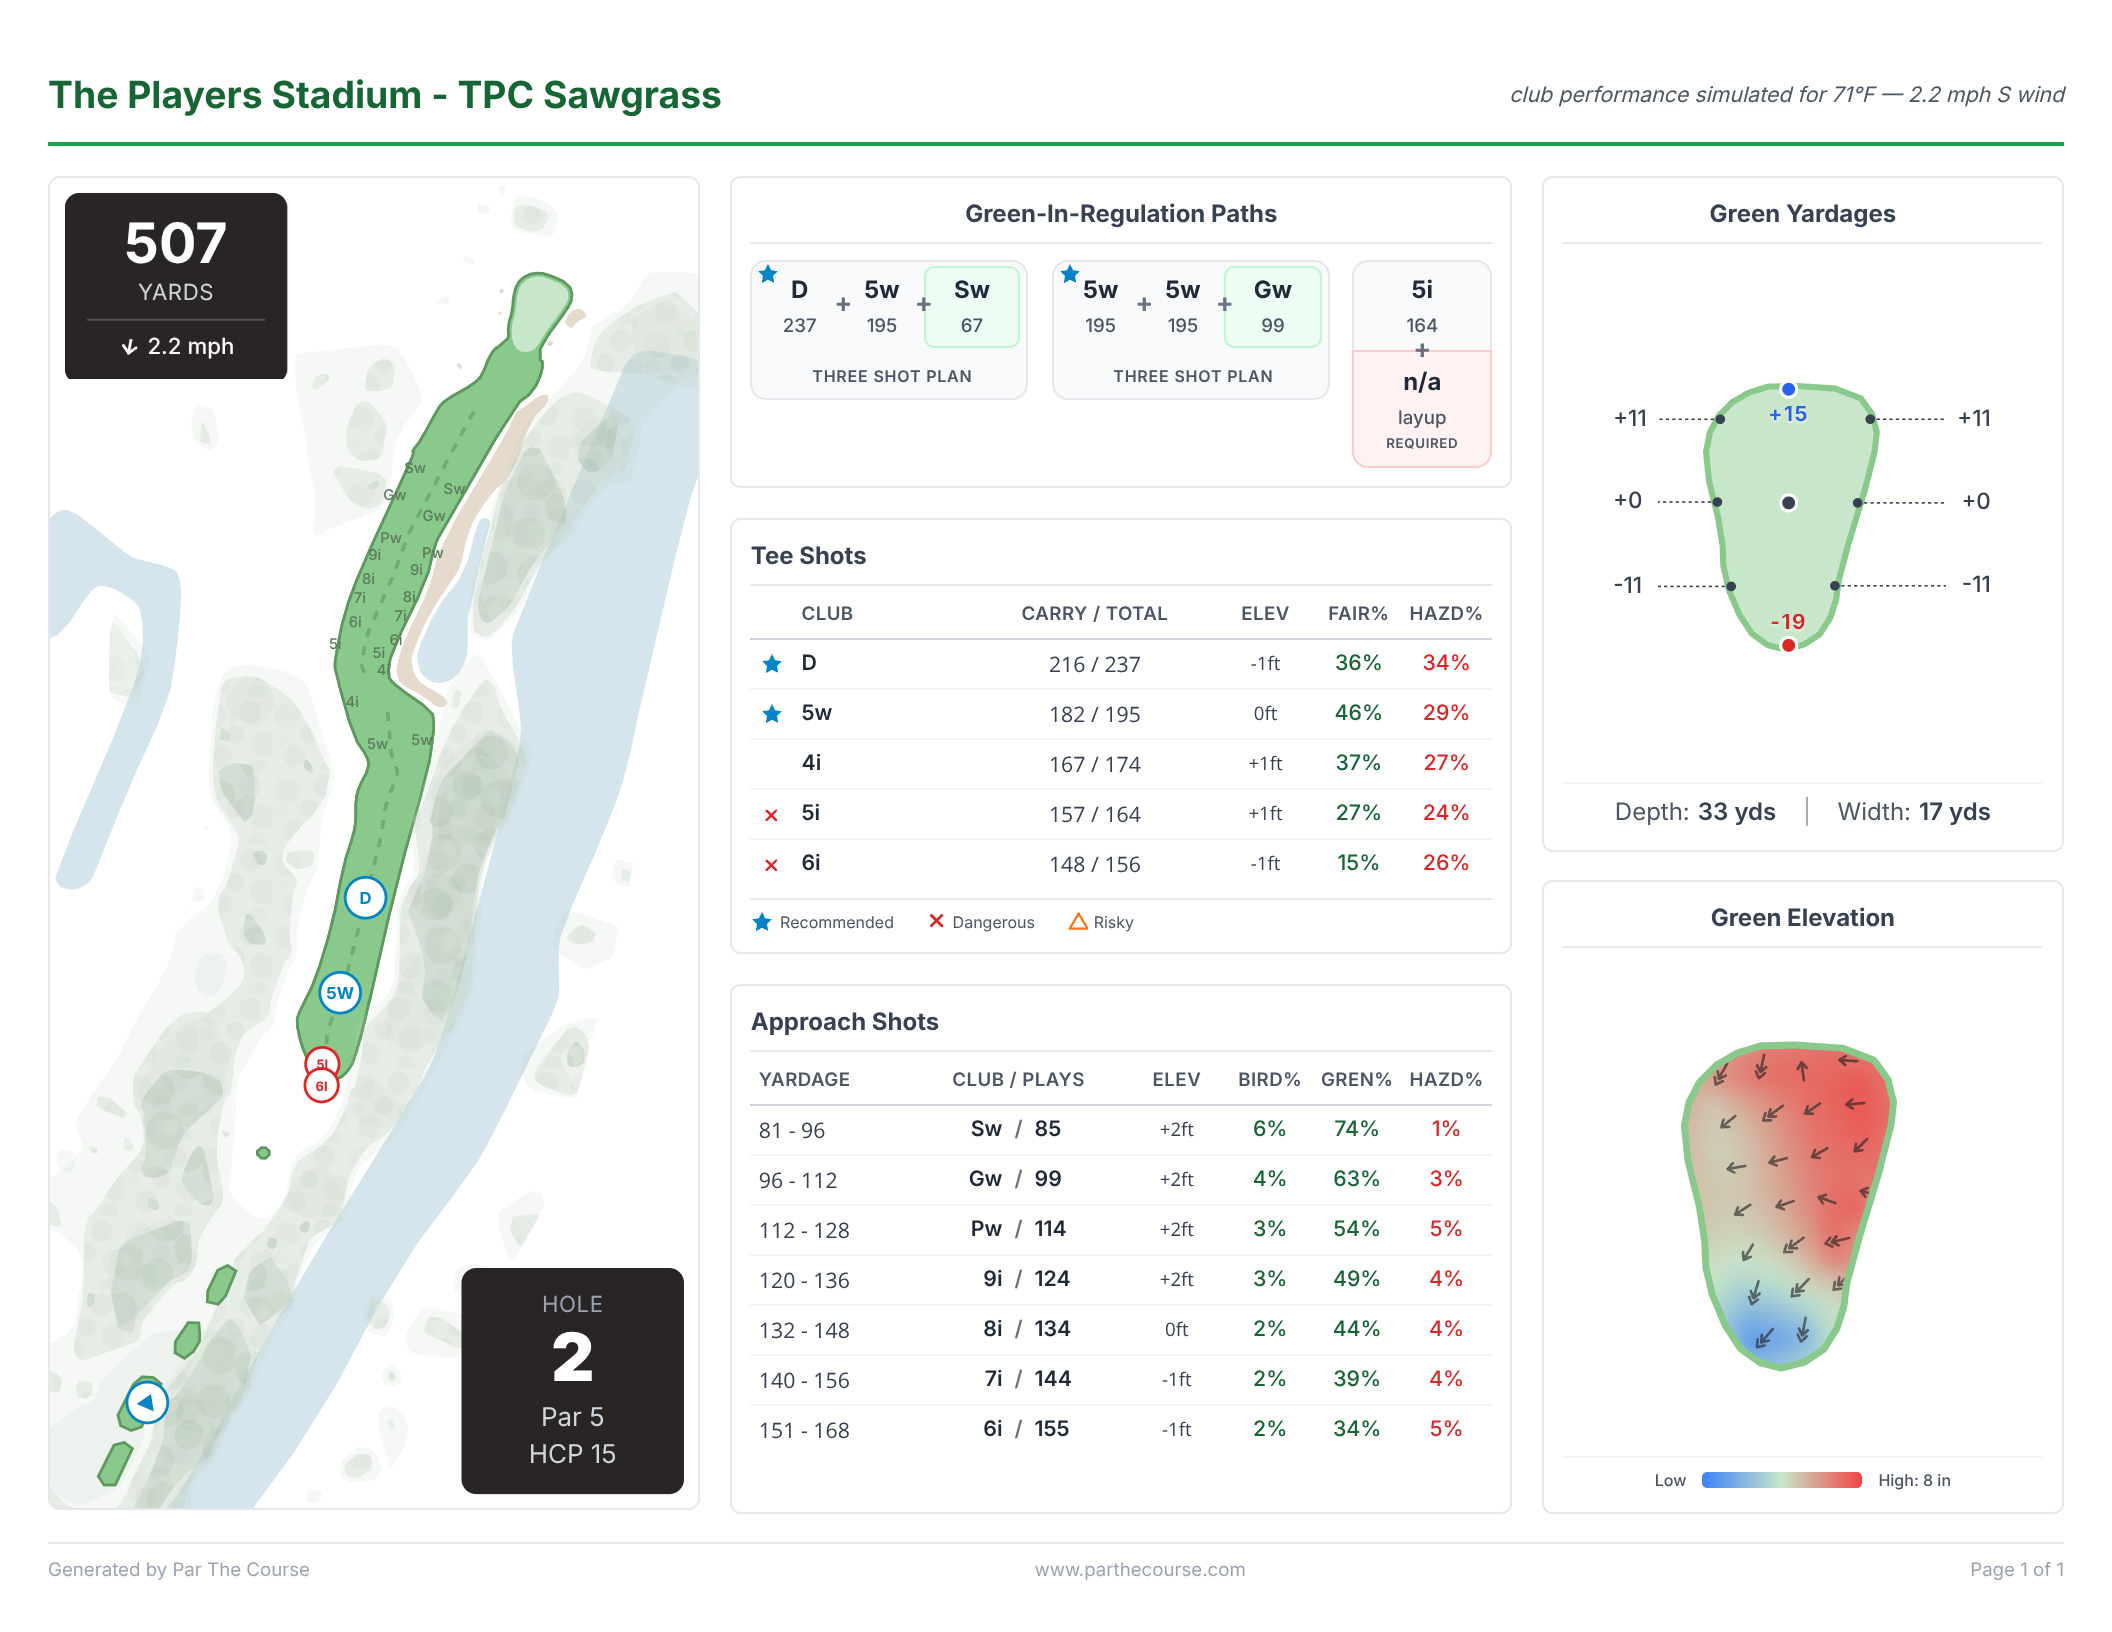
Aerial Hole Views
High-resolution aerial imagery for every hole with shot paths, landing zones, and hazard overlays so you can visualize your game plan before stepping on the tee.
Tee Shot Strategy
Data-driven tee shot recommendations showing optimal club selection, aim lines, carry distances, and hazard probabilities tailored to your specific distances.
Approach Shot Data
Detailed approach shot tables with club recommendations, yardages adjusted for elevation, and risk scores to help you pick the right shot into every green.
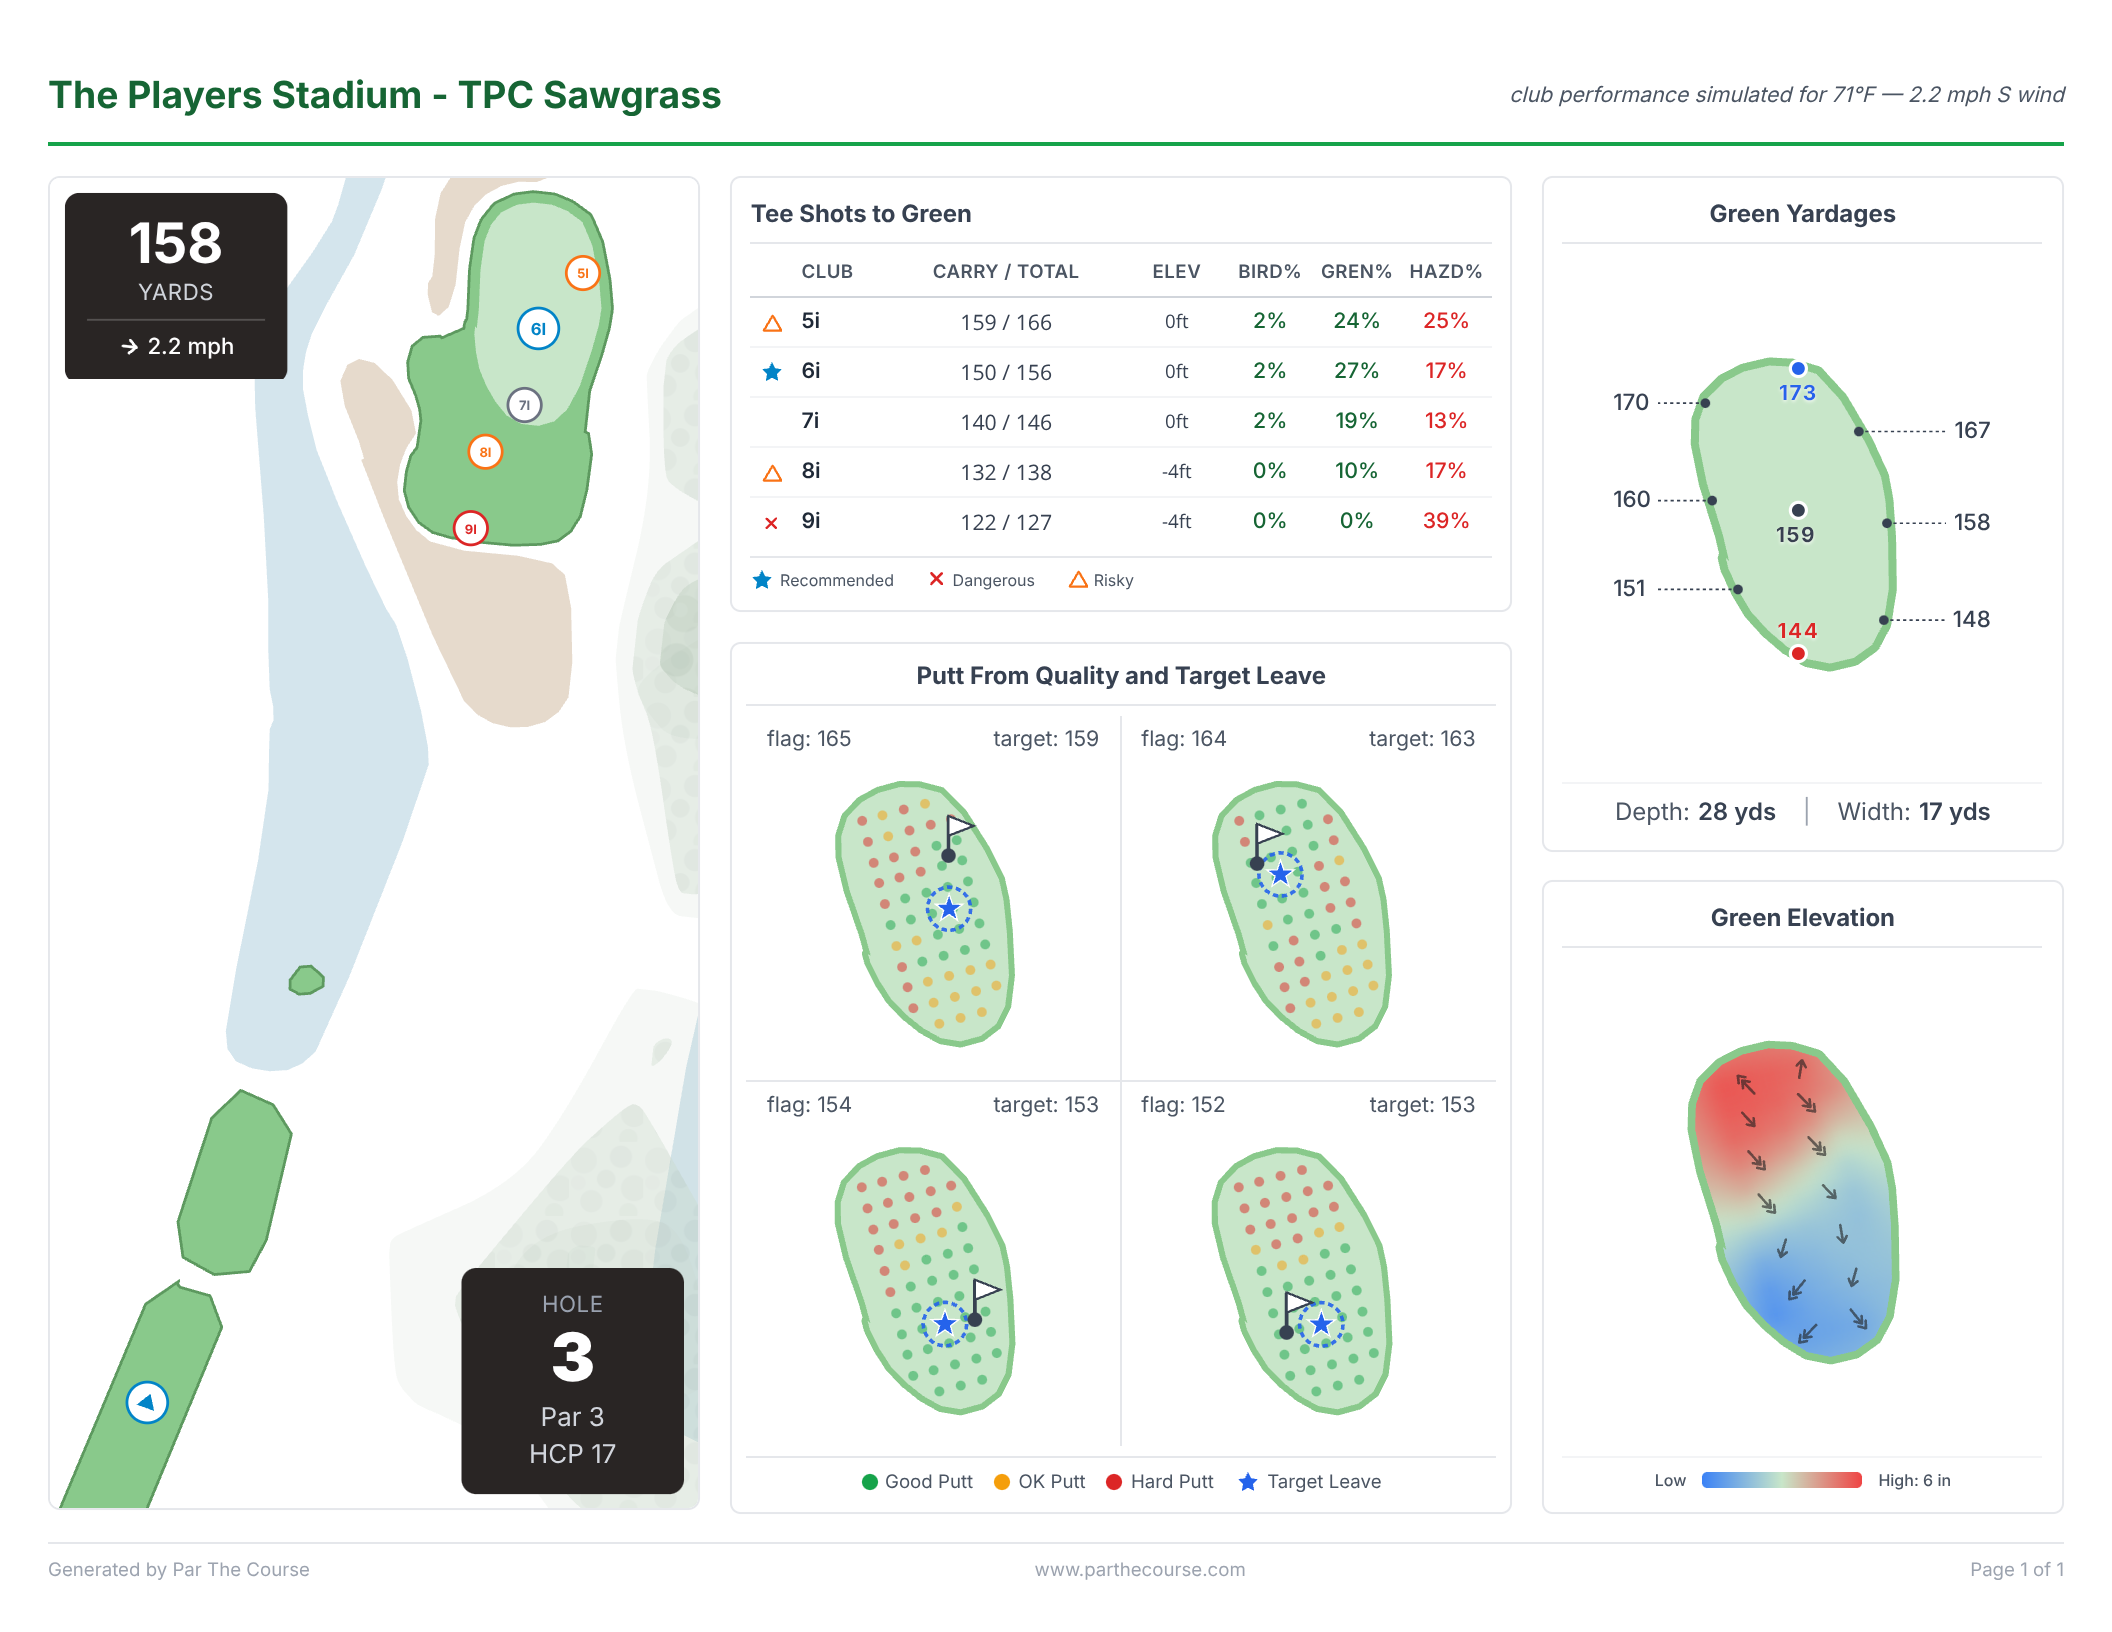
Green Reading Maps
Slope analysis and putting surface maps showing break direction, slope percentage, and best leave zones so you know where to aim before you arrive at the green.
Scoring Probabilities
Birdie probability, one-putt rates, and landing-within-18ft percentages for each strategy option so you can make smarter risk-reward decisions.
How It Works
Enter Your Club Distances
Tell us how far you hit each club. We use these real numbers — not tour averages — to build a strategy that fits your game.
Pick Your Course & Tees
Search any course in our database, choose your tee box, and set your handicap and risk preferences.
CADDIE.100 Builds Your Strategy
Our engine analyzes every hole — elevation changes, hazard placement, green contours — and generates optimal shot plans for your distances.
Print or View On-Screen
Download a beautifully formatted PDF yardage book or view it on your phone. Take it to the course and play smarter.
Page-by-Page Breakdown
A closer look at the key sections you'll find on every hole page.
Tee Shot Panel
Each hole page includes a tee shot strategy table showing your recommended club, carry and total yardage, fairway hit probability, and hazard exposure percentages. Multiple options are compared side-by-side so you can choose the right play based on the situation.
Club Selection
Matched to your actual distances, not generic recommendations
Hazard Probabilities
% chance of hitting fairway, rough, bunker, water, or trees
Approach Left
Remaining yardage and recommended approach club after each tee shot
Green Reading Map
Every green gets a detailed elevation heatmap and yardage grid. Markers show slope direction, slope percentage, break direction, and putting quality scores across the entire surface. Know exactly where the best — and worst — pin positions are before you even reach the green.
Elevation Heatmap
Color-coded contours showing high and low points
Slope Arrows
Direction and degree of break at grid points across the green
Best Leave Zones
Optimal miss areas ranked by putting difficulty
Scoring & Risk Data
Every strategy option comes with scoring probability data: birdie chance, one-putt rate, and the percentage of shots landing within 18 feet of the pin. Compare aggressive vs. conservative plays with real numbers, not guesswork.
Birdie Probability
Your actual birdie chance for each strategy option
GIR Percentage
Likelihood of hitting the green in regulation
Risk Score
Composite danger rating factoring in all hazards